728x90
반응형
로지스틱 회귀란?
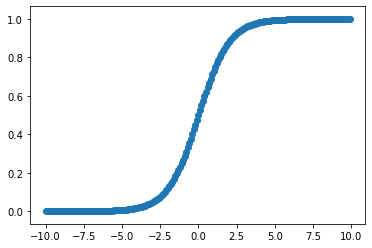
로지스틱 회귀는 지도 학습의 분류 문제에 사용된다. 데이터가 집단 각각에 속하는 확률을 계산하여 데이터를 분류해낸다. 선형함수가 아닌 로짓함수를 사용하여 진행한다. 따라서 회귀분석의 모형은 목표집단에 속할 확률과 그렇지 않을 확률의 비율에 자연로그를 취한 값을 출력한다.
이를 그려보면 비선형 S자의 형태를 띈다.
import matplotlib.pyplot as plt
import numpy as np

# f(x) = 1 / ( 1 + e ** (-x))를 그려보자
x = np.arange(-10,10,0.1)
y = 1 / ( 1 + np.exp(-x))
plt.scatter(x,y)
확률 : 발생할 확률 / 전체
오즈 : 발생할 확률 / 발생하지 않을 확률 ( 0 ~ 무한대 )
로짓 : 오즈에 자연로그를 취하여 자료를 변환한 것
독립변수가 1개일 때
앞의 글에서 사용했던 데이터로 다시 분류해보자.
import tensorflow as tf

x_data = [1,2,5,8,10,20]
y_data = [0,0,0,1,1,1]

x = tf.placeholder(dtype=tf.float32)
y = tf.placeholder(dtype=tf.float32)

W = tf.Variable(tf.random_normal([1]), name = "Weight")
b = tf.Variable(tf.random_normal([1]), name = "bias")

# logit 을 설정해주고 sigmoid함수를 사용한다
logit = W * x + b
H = tf.sigmoid(logit)

cost = tf.reduce_mean(tf.nn.sigmoid_cross_entropy_with_logits(logits = logit,
                                                              labels = y))

optimizer = tf.train.GradientDescentOptimizer(learning_rate = 0.01)
train= optimizer.minimize(cost)

sess = tf.Session()
sess.run(tf.global_variables_initializer())
for step in range(30000):
    _,cost_val = sess.run([train,cost],
                         feed_dict = {x : x_data,
                                     y : y_data})

print(sess.run(H, feed_dict={x : 7}))
앞에서는 20의 값으로 0으로 분류하였다. 이번에는?
[0.72540575]0.5 이상이므로 1로 분류할 것이다.
독립변수가 2개일 때
import tensorflow as tf

# 학습 data
x_data = [[1,1],
         [2,0],
         [5,1],
         [2,3],
         [3,3],
         [8,1],
        [10,0]]
y_data = [[0],[0],[0],[1],[1],[1],[1]]


X = tf.placeholder(shape = [None,2], dtype = tf.float32)
Y = tf.placeholder(shape = [None,1], dtype = tf.float32)

W = tf.Variable(tf.random_normal([2,1]), name = "Weight")
b = tf.Variable(tf.random_normal([1]), name = "bias")

# 독립변수가 2개이기 때문에 행렬곱을 계산한 뒤 sigmoid 적용
logit = tf.matmul(X,W) + b
H = tf.sigmoid(logit)

cost = tf.reduce_mean(tf.nn.sigmoid_cross_entropy_with_logits(logits = logit,
                                                              labels = Y))

optimizer = tf.train.GradientDescentOptimizer(learning_rate = 0.1)
train = optimizer.minimize(cost)

sess = tf.Session()
sess.run(tf.global_variables_initializer())

for step in range(30000):
    _,cost_val = sess.run([train,cost],
                         feed_dict={
                             X : x_data,
                             Y : y_data
                         })


# predict
result = sess.run(H, feed_dict = {X : [[7,1]]})
if result >= 0.5:
    print("시험에 통과했어요 : {}".format(result))
else:
    print(" 떨어졌어요 : {} ".format(result))
결과는?
시험에 통과했어요 : [[0.9379511]]
독립변수가 3개일 때
이번에는 더 많은 데이터로 학습해보자.
모듈을 로드하고 상관관계를 print하면?
import tensorflow as tf
import numpy as np
import pandas as pd
import matplotlib.pyplot as plt
from sklearn.preprocessing import MinMaxScaler
from sklearn.linear_model import LogisticRegression

# 데이터 로드
df = pd.read_csv("/machine-deep-learning/machine learning/data/admission.csv")
데이터는 요런식으로 생겼다.

gre, gpa, rank로 admit을 예측해보자. 0은 불합격, 1은 합격이다.
우선, 전처리를 해보자.
1 ) rank는 1 ~ 4를 역순으로 바꿔주자. rank1에게 많은 점수를 부여하기 위해서이다.
def change_rank(k):
    if k == 4:
        return 1
    elif k == 3:
        return 2
    elif k == 2:
        return 3
    else:
        return 4

df["rank"] = df["rank"].apply(lambda x : change_rank(x))
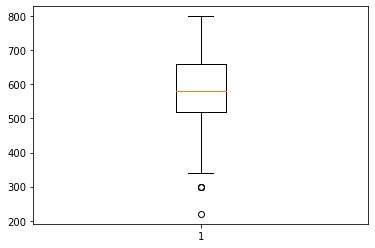
2 ) gre, gpa의 이상치를 확인하고, 제거하자.
# 이상치 확인
plt.boxplot(df['gre'])
plt.boxplot(df['gpa'])

# 이상치 제거
def process_outlier(tmp_df, tmp):
    q1,q3 = np.percentile(tmp,[25,75])
    irq = q3-q1
    upper = q3 + irq * 1.5
    lower = q1 - irq * 1.5
    mask_upper = tmp > upper
    mask_lower = tmp < lower
    tmp_df = tmp_df.loc[~(mask_upper | mask_lower)]
    return tmp_df

df = process_outlier(df,df["gre"])
df = process_outlier(df,df["gpa"])
데이터를 학습하자.
# 학습 데이터
x_data = df[["gre","gpa","rank"]].values
x_data = MinMaxScaler().fit_transform(x_data) # 0 ~ 1로 scaling
y_data = df["admit"].values.reshape(-1,1)

# 독립변수가 3개이므로 !!! None, 3
X = tf.placeholder(shape = [None,3], dtype = tf.float32)
Y = tf.placeholder(shape = [None,1], dtype = tf.float32)

W = tf.Variable(tf.random_normal([3,1]), name = "Weight")
b = tf.Variable(tf.random_normal([1]), name = "bias")

logit = tf.matmul(X,W) + b
H = tf.sigmoid(logit)

cost = tf.reduce_mean(tf.nn.sigmoid_cross_entropy_with_logits(logits = logit,
                                                             labels = Y))

optimizer = tf.train.GradientDescentOptimizer(learning_rate = 0.1)
train = optimizer.minimize(cost)

sess = tf.Session()
sess.run(tf.global_variables_initializer())

for step in range(30000):
    _,cost_val = sess.run([train,cost],
                         feed_dict={
                             X : x_data,
                             Y : y_data
                         })
예측하면 결과는 True, False 형태로 나올 것이다. 그래서 숫자로 변환해주는 함수를 사용하자.
predict = tf.cast( H >= 0.5, dtype = tf.float32)
실제 데이터와 예측 데이터를 비교하여 정확도를 확인할 수 있다.
correct = tf.equal(predict,Y)
accuracy = tf.reduce_mean(tf.cast(correct, dtype = tf.float32))
print("정확도 : {}".format(sess.run(accuracy,
                                 feed_dict = {X: x_data,
                                              Y: y_data})))
train, test set을 나눠서 해야하지만 이번엔 그냥 해보았다. 그래서 결과도 좋지않음.
0.703797459602356이정도면 사용할 수 없는 모델.!
728x90
반응형
'AI > Experiment' 카테고리의 다른 글
| 09. 나이브베이즈 분류 ( Naive Bayse classification ) (0) | 2020.05.21 |
|---|---|
| 08. 서포트 벡터 머신 ( support vector machine ) (0) | 2020.05.19 |
| 06. 선형 회귀의 한계점 (0) | 2020.05.17 |
| 05. 릿지 회귀, 라쏘 회귀 ( Ridge, Lasso ) (0) | 2020.05.15 |
| 04. 다항 회귀( Polynomial Regression ) (0) | 2020.05.14 |